
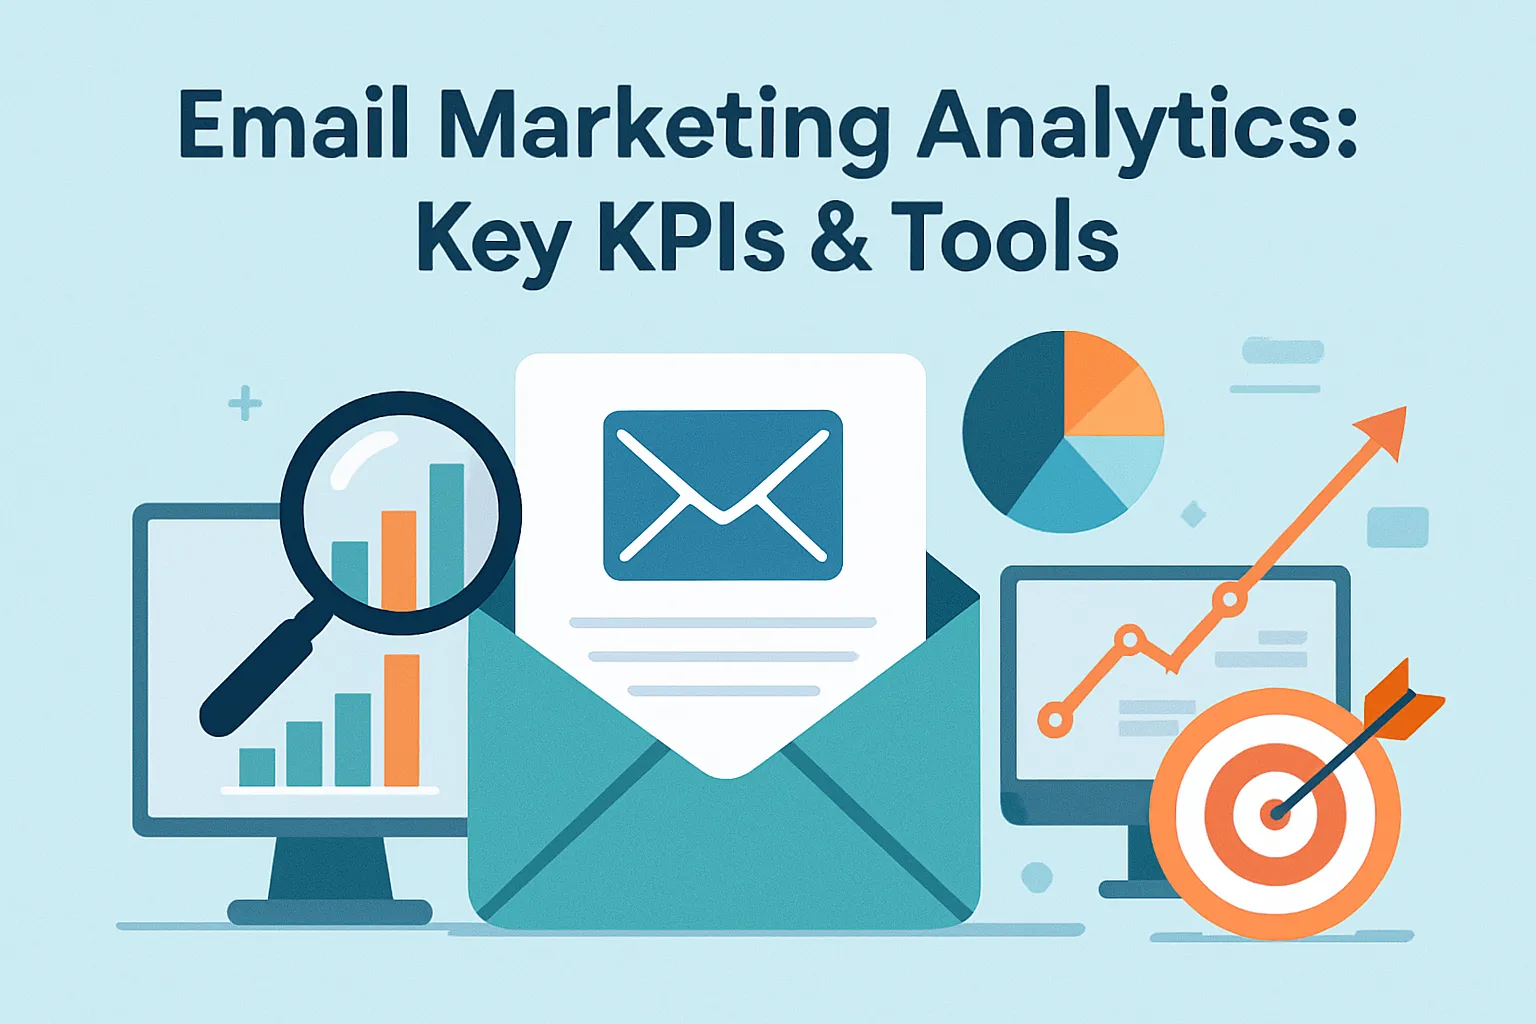

Email analytics is the data that shows how people interact with the emails you send and what happens after those emails are opened. In practice, it’s the numbers that tell you whether your message landed in someone’s inbox, if they opened it, whether they clicked a link, and if that click led to a purchase, sign-up, or other business action.
The scope of email analytics can be broken down into four layers:
- Message-level metrics – delivery rate, open rate, and bounce rate. These show whether your emails reached the inbox and if recipients noticed them.
- Engagement metrics – click-through rates, reply rates, and time spent reading. They reflect how much attention your content receives.
- Deliverability signals – spam complaints, unsubscribes, and list hygiene. These help you understand if providers view your emails as trustworthy.
- Downstream conversions – sales, sign-ups, or booked meetings. These are the ultimate measures of whether your emails create business results.
For example, if you send a newsletter to 5,000 contacts and 1,000 open it, that’s a 20% open rate. If 150 people then click on a product link, the click-through rate is 3%. If 30 of those clicks result in purchases, that’s the downstream conversion. Each number tells a part of the story, and together they help you see where your funnel is strong and where it leaks.
Why businesses need email analytics
The data helps businesses earn more from each email, keep customers engaged, and make smarter decisions about where to spend time and money.
The most visible benefits:
— Financial
When you track how many people open, click, and buy, you can spot weak points and fix them quickly. If a store sends a discount campaign and sees many opens but few purchases, the issue is likely in the offer, not in the subject line. By correcting the right part of the chain, the business makes more revenue from the same number of emails. Over time, that means a higher return per send, lower acquisition costs, and faster movement of leads through the funnel.
— Resources
By comparing engagement across different newsletters, a marketing team can see which topics people care about and which ones they skip. This allows them to focus on content that drives clicks instead of wasting effort on what doesn’t work. Deliverability metrics also act as an early warning system: if complaints or unsubscribes rise, the team knows it’s time to adjust frequency or targeting before inbox providers start filtering their messages out. Sales teams benefit too. If analytics shows that one follow-up email template consistently brings more replies, managers can roll it out across the team and retire the weaker versions.
— Strategic
Executives and directors need clear numbers to decide where to allocate budget. Email analytics provides that evidence. A marketing director can present a report showing that campaigns generated a specific amount of revenue last quarter and that the cost per lead was lower than in paid channels. That proof makes it easier to defend budget requests, align teams on goals, and show the board where the company’s growth is really coming from.
Delivery rate & deliverability signals
Delivery rate is the share of messages that recipient mail servers accept when you send them. If you send 10,000 emails and 9,500 are accepted, the delivery rate is 95%. This is the first thing to check because nothing that follows—opens, clicks, conversions—can happen if messages are rejected.
Delivery is the baseline for every other metric. Low delivery means fewer opens and clicks, even if your creative and offer are good. If delivery drops, you need to fix that before you chase subject lines or calls-to-action.
What to check:
- List hygiene. Invalid addresses and stale contacts cause hard bounces. If a list has many invalid emails, servers will reject messages and your delivery falls. For example, a team that purchased a contact list saw delivery drop sharply; after removing invalid addresses and stopping purchased-list sends, delivery recovered.
- Sending reputation and authentication. Mail systems judge whether the sender is trustworthy. Authentication records (SPF, DKIM, DMARC) are simple DNS entries that prove emails come from an authorized source. A poor reputation—because of past spam complaints or sudden high volumes—makes servers more likely to reject or defer messages.
- Throttling and volume patterns. Sending a large batch from a new domain or IP can trigger rate limits. Gradually increasing volume avoids server rejections.
- Deliverability signals. Watch bounce categories, spam complaint rates, and unsubscribe spikes. A sudden rise in complaints or hard bounces is a clear sign to pause and investigate.
Hard bounces mean permanent problems (address doesn’t exist). Soft bounces are temporary (inbox full, temporary server issue).
Check trends: sudden increases in hard bounces or complaints usually point to list quality or a tainted sending stream. If servers report rejections, examine authentication and recent changes to sending behavior.
Next steps:
- Remove or suppress hard bounces and long-inactive addresses; try a short re-engagement on uncertain addresses before removal.
- Confirm SPF/DKIM/DMARC records are present and correctly configured.
- Stagger large campaigns and warm up any new domain or IP by starting with small volumes and increasing gradually.
- Set alerts for bounce spikes and complaint increases and pause large sends if those alerts trigger.
Open rate
Open rate is the percentage of delivered emails where the recipient viewed the message. If 1,000 of 5,000 delivered emails register as opened, the open rate is 20%. It’s a quick measure of whether the subject line and sender caught attention.
Open rate signals sender recognition and subject-line relevance. If new subscribers open far less than long-term subscribers, the subject line or sender name may feel unfamiliar. If opens are high but clicks are low, the problem is likely the message content or the call-to-action, not the subject line.
Common pitfalls:
- Relying on opens alone to judge success. An open does not equal a click or a sale.
- Treating a single open-rate benchmark as universal. Lists, audience type, and message purpose change expected rates.
- Misreading privacy-inflated opens as genuine engagement.
Pair open rate with CTR and CTOR. CTR shows how many recipients clicked links; CTOR (click-to-open rate) shows how compelling the content was for those who opened. For example, a high open rate and low CTOR point to weak content or unclear calls-to-action. Segment by new versus returning recipients to see whether familiarity is the issue.
Quick tests to improve opens:
- Run subject-line A/B tests to see which wording gains more opens.
- Resend to non-openers with a changed subject line and adjusted preview text.
- Test sender name and preview text variations to increase recognition for new subscribers.
Conversion rate & revenue per recipient
Conversion rate shows how many recipients completed the desired action after receiving an email. That action could be a purchase, a booked demo, or a newsletter sign-up.
Revenue per recipient (RPR) takes this one step further and expresses the average revenue generated per delivered email. These two metrics connect email performance directly to business outcomes.
Tracking conversions and RPR helps marketing prove ROI and justifies budget and resources. How to measure:
- Add tracking tags like UTMs to links so that website visits from emails can be tied back to a specific send.
- Make sure backend systems — such as e-commerce platforms or CRMs — attribute revenue and actions to the right email campaign.
Suppose a retailer sends 20,000 emails promoting a new product. The campaign results in 400 purchases worth $20,000 in total revenue. Conversion rate is 400 ÷ 20,000 = 2%. RPR is $20,000 ÷ 20,000 = $1. That means, on average, each delivered email generated one dollar of revenue. If a follow-up campaign raises RPR to $1.30, that uplift shows clear progress.
Pitfalls to watch:
- Cross-channel activity can blur results. A customer might open an email on their phone but later buy through a desktop search.
- Privacy settings and device switching can also hide part of the conversion path. This is why email results are best read as directional trends over time, not as exact numbers down to the last cent.
Bounce rate, unsubscribe rate, and spam complaints
These three metrics don’t show business growth. They act as warning signals that your list quality, targeting, or content may be off track.
- A bounce means the email could not be delivered. Hard bounces are permanent (the address doesn’t exist). Soft bounces are temporary (the inbox is full or the server is unavailable).
- An unsubscribe means a person actively chooses to stop receiving emails.
- A spam complaint means someone clicked “Report spam,” which signals distrust and damages sender reputation.
Unsubscribes are not always bad. They can help keep a list healthy by filtering out people who don’t want to hear from you. A sudden spike, however, is a red flag that emails are either too frequent or irrelevant.
Spam complaints are more serious. Even a small percentage is a strong signal that recipients feel tricked or annoyed, and inbox providers take those complaints seriously. For bounces, repeated hard bounces suggest poor list hygiene.
What actions to take:
- Suppress all hard-bounced addresses right away. Continuing to send to them damages reputation.
- Monitor unsubscribe trends. If they rise after certain campaigns, review targeting, frequency, and messaging.
- Treat spam complaints as urgent. Recheck permission practices, simplify opt-outs, and refine targeting to avoid sending to people who never engaged.
List growth and engagement scoring
List growth measures how many new subscribers join compared to how many leave. It’s a net calculation: new sign-ups minus unsubscribes and hard bounces.
Engagement scoring helps you understand how active your audience is. The most common inputs are:
- Recency. When someone last opened or clicked.
- Frequency. How often they engage.
- Monetary value. How much revenue they generate, if sales are tied to email.
By combining these signals, you can build simple tiers:
- Active. Regularly opening, clicking, or purchasing.
- At-risk. Haven’t interacted in a while.
- Inactive. No engagement over a long period.
Treat each tier differently instead of sending the same campaign to everyone. Active subscribers might get regular updates or early access to new products. At-risk subscribers could receive re-engagement campaigns or lighter frequency to reduce fatigue.
Inactive subscribers should be suppressed after a final win-back attempt. This protects deliverability and focuses resources on people who are more likely to convert.
Types of tools & selection criteria
Analytics can come from different layers of the stack, and each serves a different purpose.
— Email service providers (ESPs)
Most offer built-in dashboards with basic KPIs like delivery, opens, clicks, and unsubscribes. They’re quick to set up but usually stop at surface-level reporting.
— Dedicated email analytics platforms
These focus specifically on deeper engagement and deliverability analysis. They’re useful when you need more than your ESP can provide, such as tracking reputation signals or comparing performance across multiple senders.
— CRM-integrated reporting
If sales and customer data sit in a CRM, tying email metrics into it gives a full view of how campaigns move leads down the pipeline.
— Customer data platforms (CDPs)
These connect email events with web, app, and offline data, allowing you to see how email fits into the wider customer journey.
— BI and visualization tools
Business intelligence platforms pull data from multiple sources and present it in custom dashboards. They’re the go-to option when executives need tailored reporting across channels.
The right tool depends less on feature lists and more on how the data will be used:
- Numbers must match what’s happening in reality. If revenue attribution is inconsistent, trust in email as a channel will fade.
- The tool should connect easily with your CRM, ecommerce system, or data warehouse so that metrics reflect business outcomes, not just clicks.
- Real-time or batch? Real-time reporting helps optimize campaigns while they run. Batch updates once or twice a day can be enough for strategic reporting.
- Teams should be able to build and adjust views without heavy developer work.
- For businesses in regulated industries or with international customers, data protection and privacy standards must be part of the decision.
Choosing tools and patterns comes down to scale and business needs. A small team may be fine with an ESP dashboard. A growing company might layer on CRM reporting to show how campaigns influence pipeline. Enterprises often use BI tools to unify email data with every other channel. The key is not the number of charts but whether those charts lead to better decisions and measurable business outcomes.
It's time to try LetsExtract (it's free)
 Click here to download the LetsExtract Email Studio
The trial version will allow you to create a contact list, check email addresses and start mailing.
Related posts:
 Nonexistent and invalid email addresses: can they be brought back to life?
 Omnichannel marketing: how to combine email, SMS, push & social
 What is spam, and how to protect yourself from it
 Email extractors: a complete guide to charge your lead generation
 Why you shouldn’t buy email lists for your campaigns — risks, laws & better alternatives
 A/B testing in email campaigns: how to improve ROI
